The line graph shows the total quantities of items (P + Q) dispatched and the quantities of item Q dispatched from four warehouses (A, B, C & D) i...
Question
The line graph shows the total quantities of items (P + Q) dispatched and the quantities of item Q dispatched from four warehouses (A, B, C & D) in the month of March.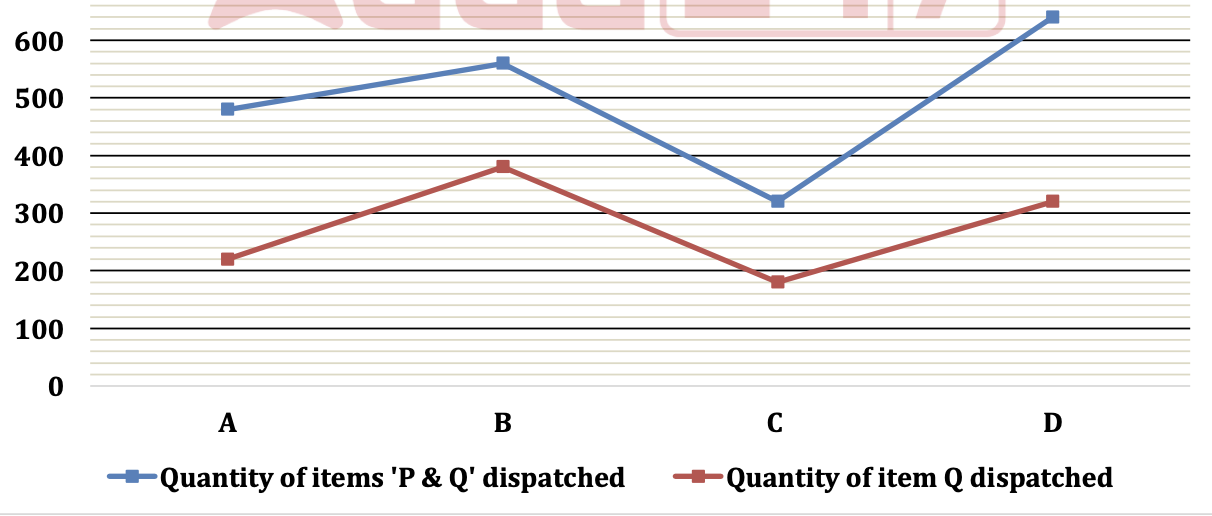
It is given that the total quantity of item Q dispatched from warehouse C in February is 20% less than the total quantity of item P dispatched from warehouse A in March. Also, the ratio of the total quantity of item P dispatched from warehouse C in March to February is 5:4 respectively.
Find the total quantity of items P and Q together dispatched from warehouse C in February.