The pie chart (i) shows the percentage distribution of total cars (Petrol + Diesel) manufactured by six companies in 2019, and pie chart (ii) shows th...
Question
The pie chart (i) shows the percentage distribution of total cars (Petrol + Diesel) manufactured by six companies in 2019, and pie chart (ii) shows the percentage distribution of petrol cars manufactured by the same companies in 2019.
Total cars manufactured by company F is given as 300 units.
Using the data below, find the ratio of the number of diesel cars manufactured by companies A and C together to the total number of cars manufactured by company F.
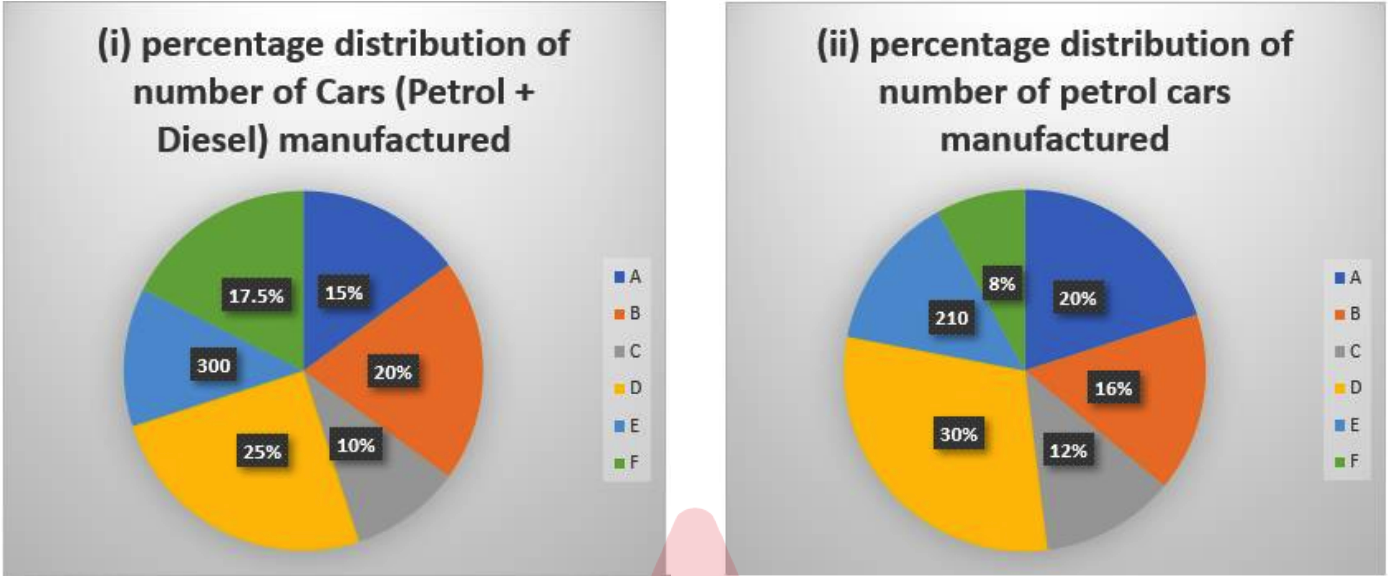
What is the ratio of diesel cars manufactured by companies A and C together to the total cars manufactured by company F?