The pie chart (i) shows the percentage distribution of the total number of cars (Petrol + Diesel) manufactured by six companies in 2019. The pie chart...
Question
The pie chart (i) shows the percentage distribution of the total number of cars (Petrol + Diesel) manufactured by six companies in 2019. The pie chart (ii) shows the percentage distribution of petrol cars manufactured by the same companies in 2019.
Given:
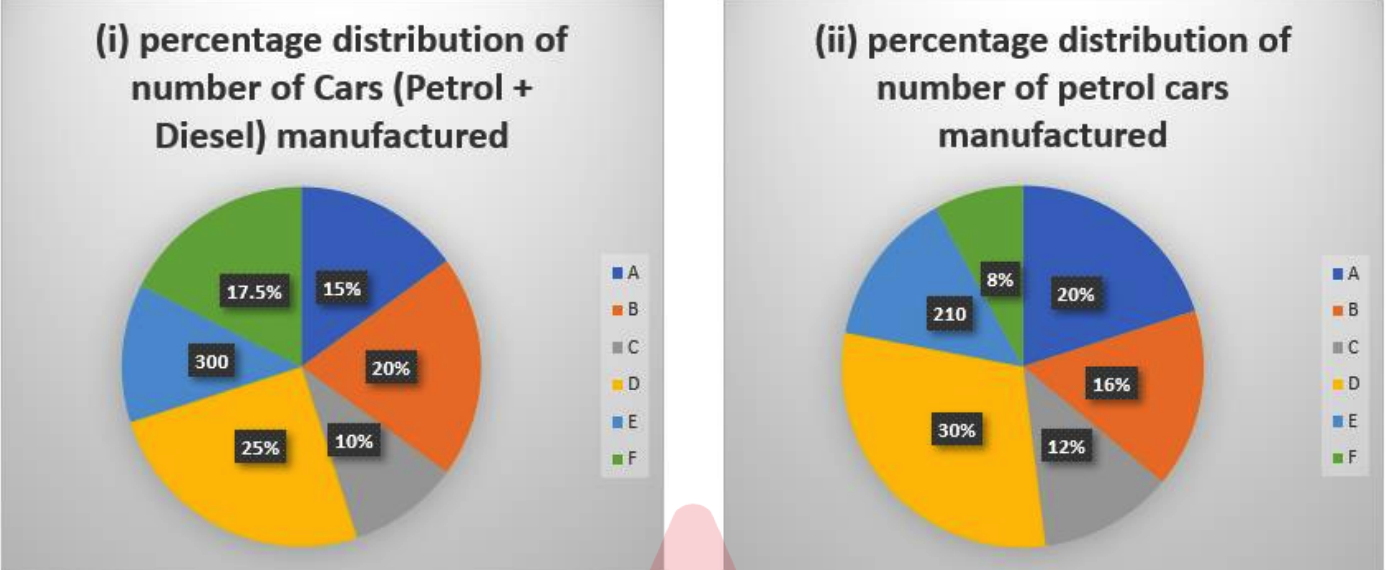
What is the central angle (in degrees) corresponding to the diesel cars manufactured by company E in the pie chart?