The pie chart (i) shows the percentage distribution of the total number of cars (Petrol + Diesel) manufactured by six companies in 2019, and pie chart...
Question
The pie chart (i) shows the percentage distribution of the total number of cars (Petrol + Diesel) manufactured by six companies in 2019, and pie chart (ii) shows the percentage distribution of petrol cars manufactured by the same companies in 2019.
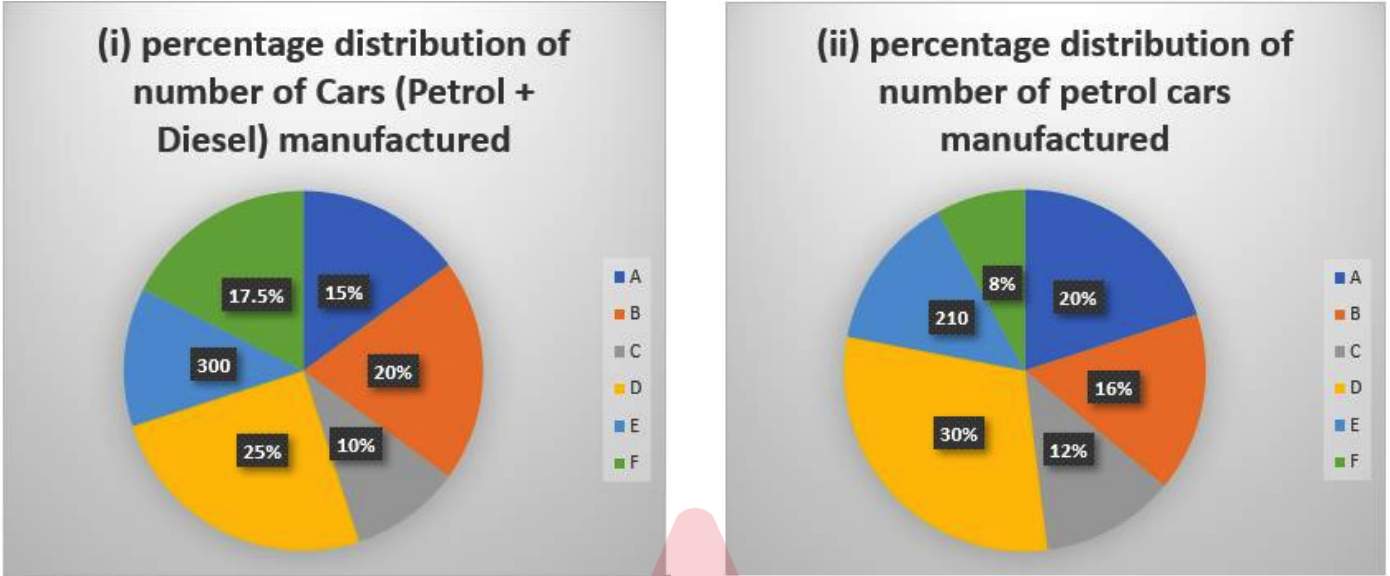
Two-fifth of the cars of company D remain unsold. If 65% of the unsold cars are petrol cars, find the number of diesel cars sold by company D.