The pie chart (i) shows the percentage distribution of the total number of cars (Petrol + Diesel) manufactured by six companies in 2019. The pie chart...
Question
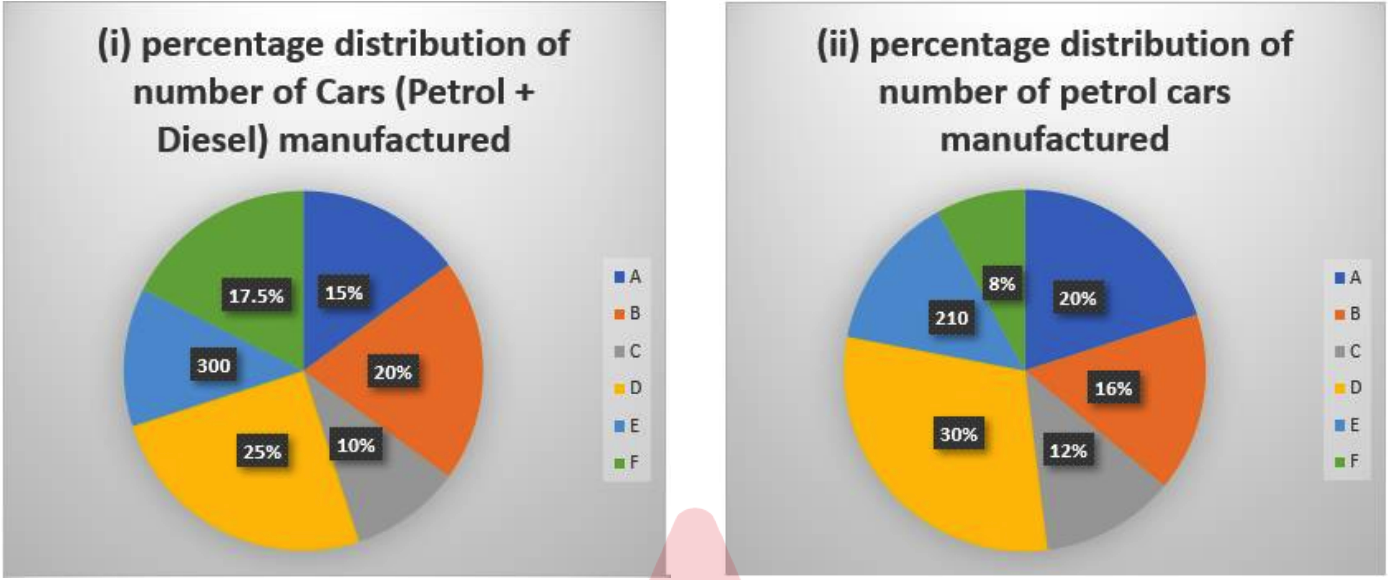
The pie chart (i) shows the percentage distribution of the total number of cars (Petrol + Diesel) manufactured by six companies in 2019. The pie chart (ii) shows the percentage distribution of petrol cars manufactured by the same companies in 2019.
If another company X manufactures 20% more cars than company B and the ratio of diesel to petrol cars manufactured by it is 5:3, then find the difference between the number of petrol and diesel cars manufactured by company X.