The pie chart (i) shows the percentage distribution of the total number of cars (Petrol + Diesel) manufactured by six companies in 2019. The pie chart...
Question
The pie chart (i) shows the percentage distribution of the total number of cars (Petrol + Diesel) manufactured by six companies in 2019. The pie chart (ii) shows the percentage distribution of petrol cars manufactured by the same companies in 2019.
Total number of cars manufactured by company F is 300, and total petrol cars manufactured by company F is 210.
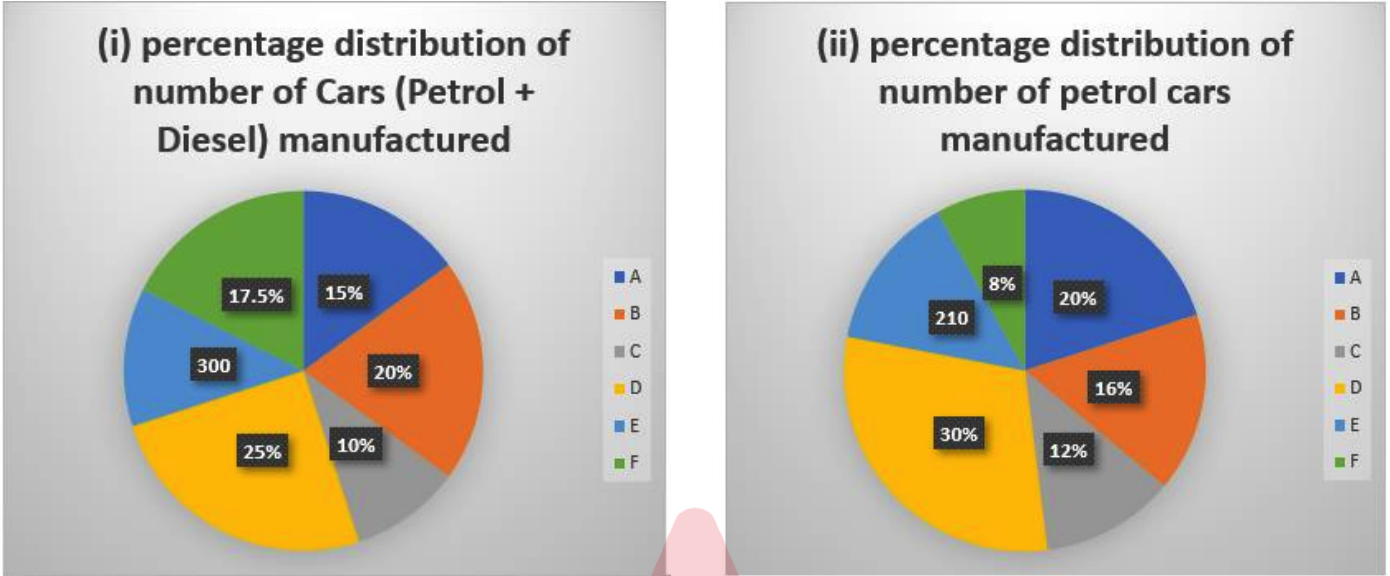
Find the average number of petrol cars manufactured by companies A, B, and C.