The pie chart shows the distribution of students in five government schools out of a total of 15,000 students. The percentage of students in each scho...
Question
The pie chart shows the distribution of students in five government schools out of a total of 15,000 students. The percentage of students in each school is as follows:
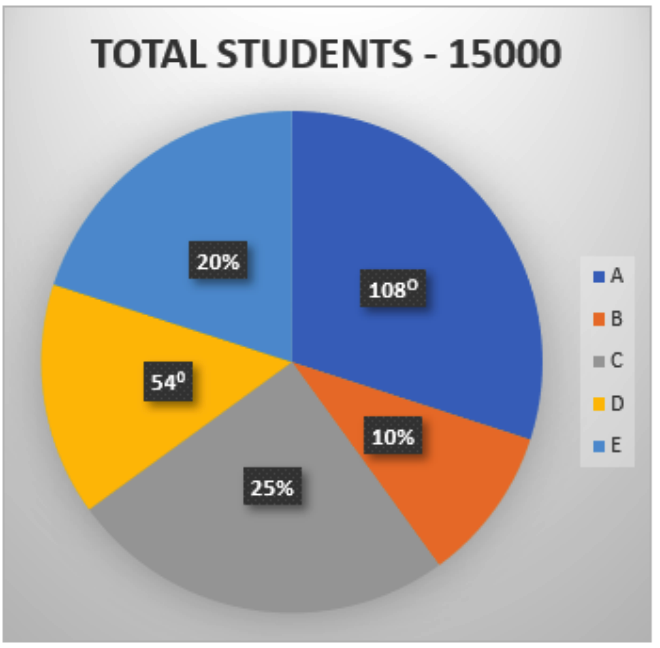
Find the difference between the total number of students studying in schools A and D together and those studying in schools B and C together.