The bar graph below shows the total number of people (men and women) and the number of men visiting five different yoga centers (P, Q, R, S, and T) in...
Question
The bar graph below shows the total number of people (men and women) and the number of men visiting five different yoga centers (P, Q, R, S, and T) in a town.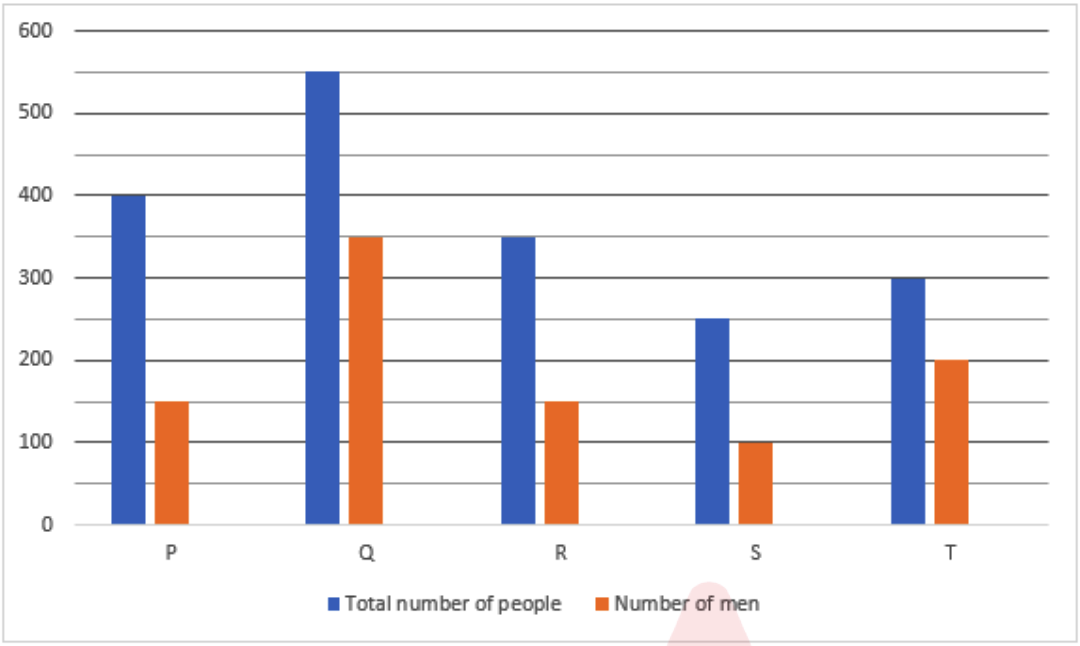
Using the data from the graph, calculate the number of women visiting yoga Centre Q as a percentage of the number of men visiting yoga Centre T.