The bar graph shows the total number of people (men and women) and the number of men visiting five different yoga centers (P, Q, R, S, and T) in a tow...
Question
The bar graph shows the total number of people (men and women) and the number of men visiting five different yoga centers (P, Q, R, S, and T) in a town.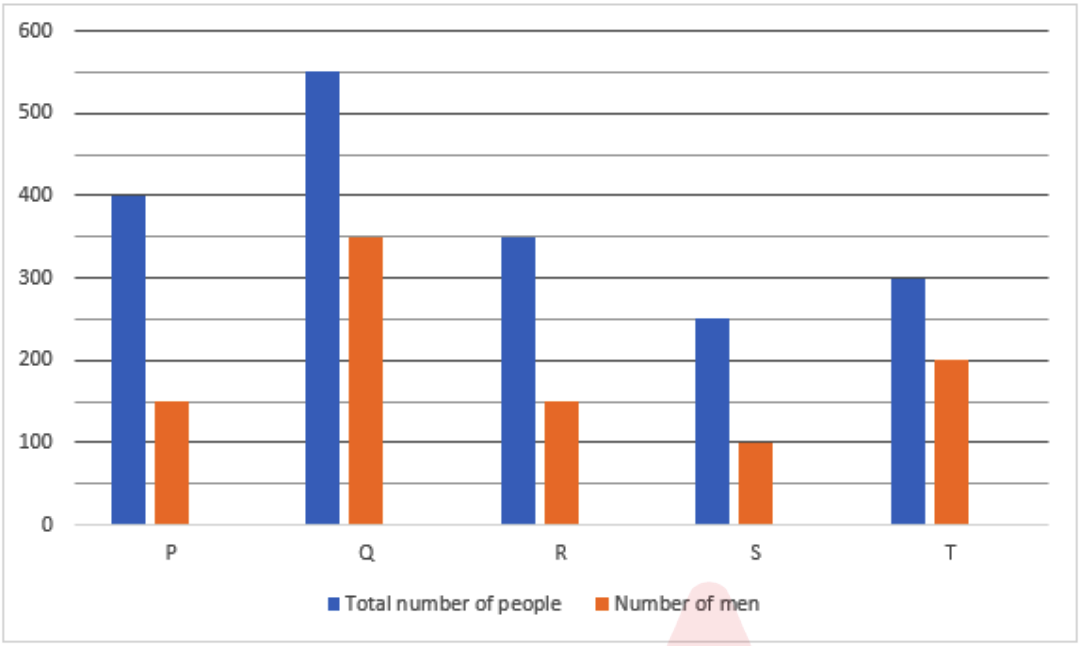
Using the graph, find the difference between the average number of men visiting yoga Centres T and Q together and the average number of women visiting yoga Centres P and R together.