Study the line chart and table given below and answer the question. The line chart shows the number of chairs manufactured by four different manufactu...
Question
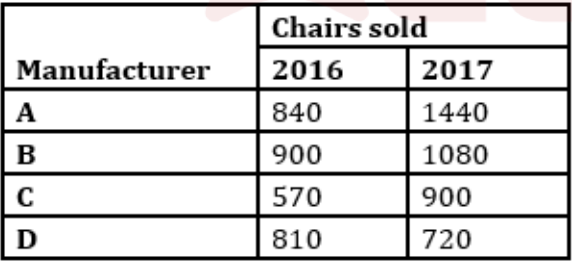
Study the line chart and table given below and answer the question.
The line chart shows the number of chairs manufactured by four different manufacturers (A, B, C & D) in 2016 and 2017. The table shows the number of chairs sold by these manufacturers in the same years.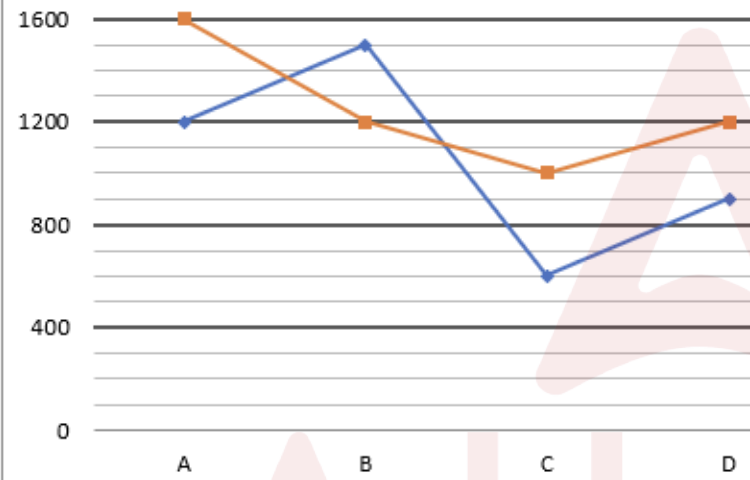
What is the percentage of unsold chairs of manufacturers A and D together in 2016 with respect to the sold chairs of manufacturers B and D together in 2017?