Study the line chart and table given below and answer the question. The line chart shows the number of chairs manufactured by four different manufactu...
Question
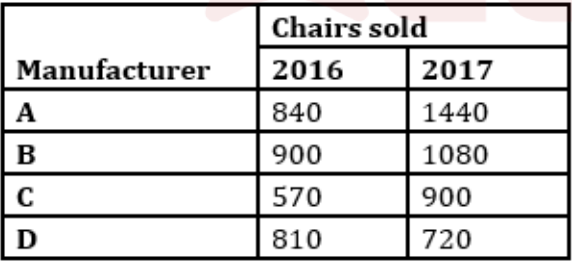
Study the line chart and table given below and answer the question.
The line chart shows the number of chairs manufactured by four different manufacturers (A, B, C & D) in 2016 and 2017. The table shows the number of chairs sold by these manufacturers in the same years.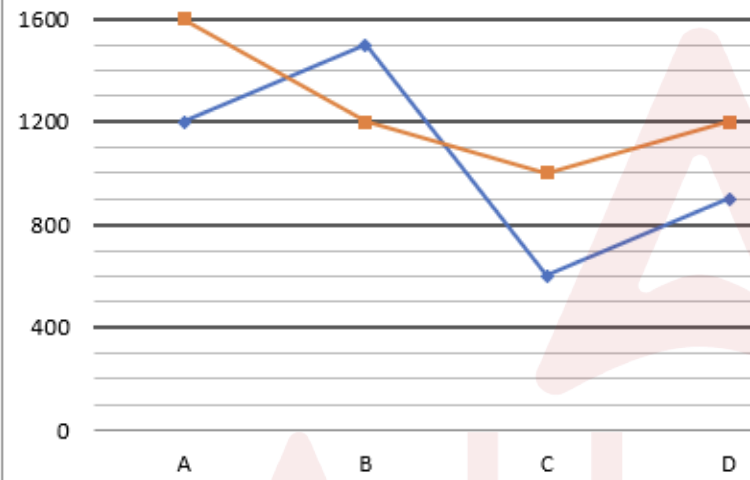
If the manufacturing cost of a chair for manufacturer D is Rs. 200 in both 2016 and 2017, and the selling price of a chair for D is Rs. 250 in 2016 and Rs. 400 in 2017, then find in which year the profit percentage for D is maximum. (Note: D destroyed all unsold chairs in both years.)