Study the line chart and table given below and answer the question. The line chart shows the number of chairs manufactured by four manufacturers (A, B...
Question
Study the line chart and table given below and answer the question.
The line chart shows the number of chairs manufactured by four manufacturers (A, B, C & D) in 2016 and 2017. The table shows the number of chairs sold by these manufacturers in the same years.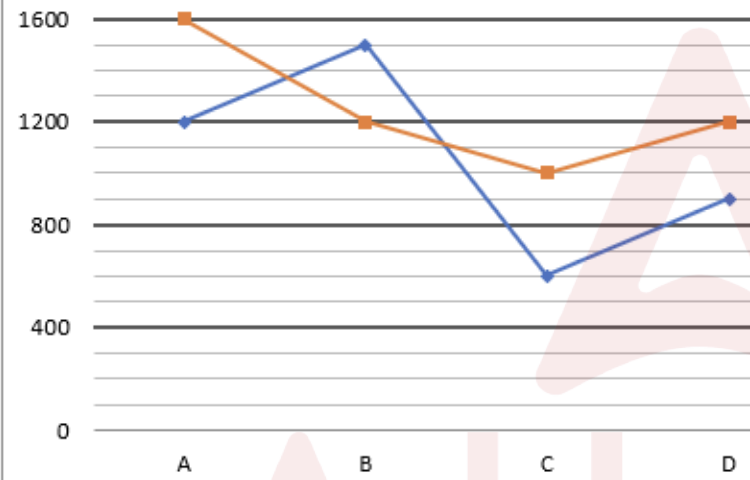
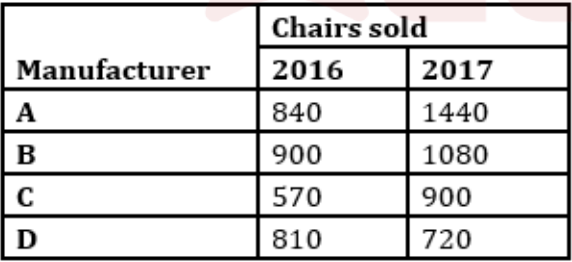
Find how much the average number of chairs sold by A, B, C & D in 2016 is more or less than the total number of unsold chairs of A, B, C & D together in 2017.