The following Venn diagram shows people's liking for Tea, Coffee and Soup. How many people like tea and coffee both?
Question
The following Venn diagram shows people's liking for Tea, Coffee and Soup.
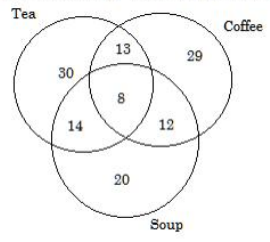
How many people like tea and coffee both?
The following Venn diagram shows people's liking for Tea, Coffee and Soup.
How many people like tea and coffee both?