The following bar graph shows the sales of a company (in₹ crore) in different years. Study the graph and answer the question. The mean of the highest ...
Question
The following bar graph shows the sales of a company (in₹ crore) in different years. Study the graph and
answer the question.
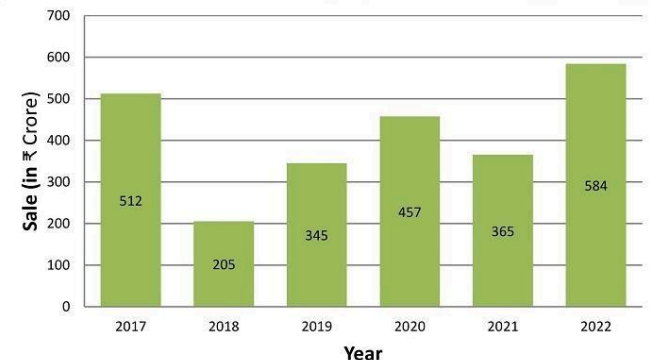
The mean of the highest and lowest sales (in₹ crore) is: