Study the given bar-graph showing the number of engineers in Bhutan, Japan, Nepal, Australia, USA, and India: 55, 25, 65, 85, 98, and 120 respectively...
Question
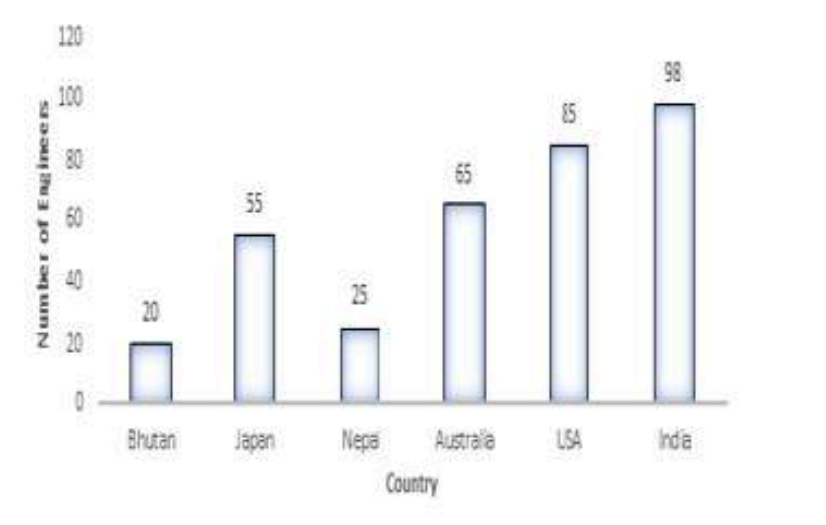
Study the given bar-graph showing the number of engineers in Bhutan, Japan, Nepal, Australia, USA, and India: 55, 25, 65, 85, 98, and 120 respectively. What is the ratio of the number of engineers of countries with an above average to the number of engineers of countries with a below average?