The given bar graph shows sugar imports of a country (in thousand tonnes) over the years 2010 to 2016. Calculate the average sugar imports (in thousan...
Question
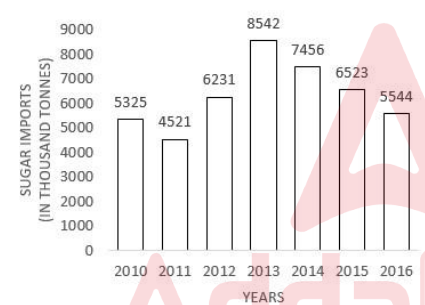
The given bar graph shows sugar imports of a country (in thousand tonnes) over the years 2010 to 2016. Calculate the average sugar imports (in thousand tonnes) for all the years.