The given graph represents the data on the ages of various children with the following distribution: Age (in years): 1, 2, 3, 4, 5 Number of children:...
Question
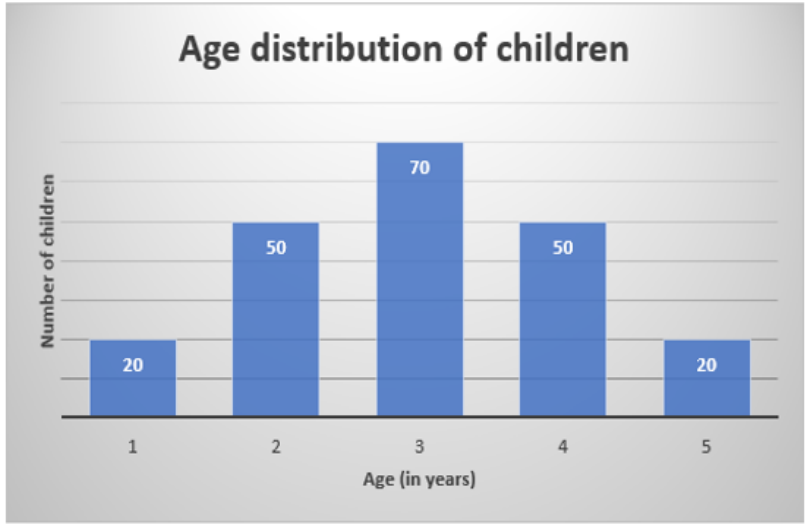
The given graph represents the data on the ages of various children with the following distribution:
Age (in years): 1, 2, 3, 4, 5
Number of children: 20, 50, 70, 50, 20
What is the difference between the mean and mode of the ages?