The given bar graph shows the actual production and targeted production of electric cars from 2019 to 2022. Study the given bar graph and answer the q...
Question
The given bar graph shows the actual production and targeted production of electric cars from 2019 to 2022. Study the
given bar graph and answer the question that follows.
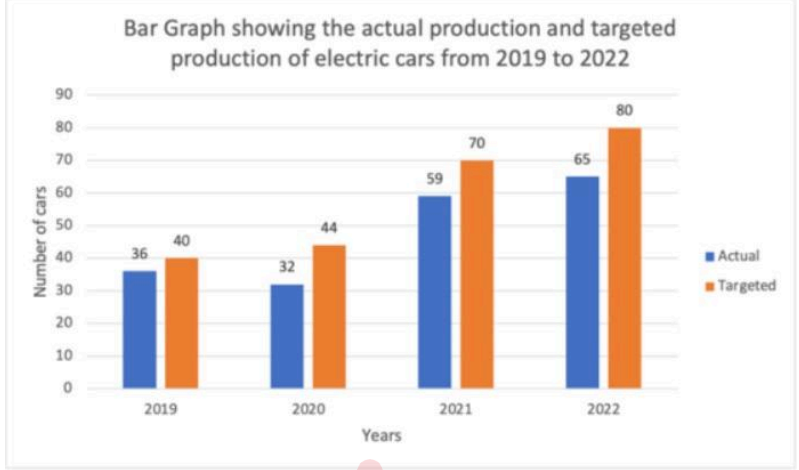
What is the ratio of the total targeted production of cars in 2021 and 2022 tothe actual production of cars from 2019 to 2022
taken together?