The following bar graph shows the number of students who passed the exam of GATE in the given years 2018, 2019, and 2020. What was the percentage incr...
Question
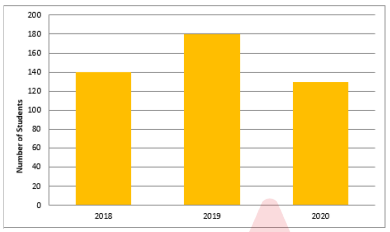
The following bar graph shows the number of students who passed the exam of GATE in the given years 2018, 2019, and 2020. What was the percentage increase in the number of students in 2019 over 2018 (rounded off to two decimal places)?