The bar graph given below shows the sales of ball pens (in thousand numbers) from six shops S1, S2, S3, S4, S5, and S6, during two consecutive years, ...
Question
The bar graph given below shows the sales of ball pens (in thousand numbers) from six shops S1, S2, S3, S4, S5, and S6, during two consecutive years, 2011 and 2012.
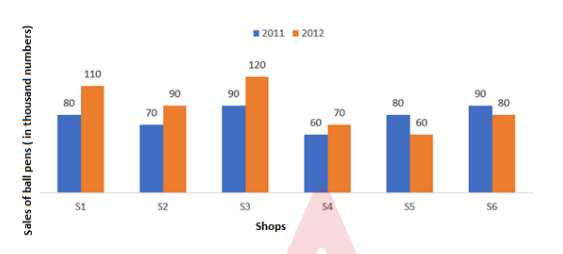
What's is the ratio of the total sales of shop S2 for both years to the total sales of shop S5 for both years?