Study the given bar graph and answer the question that follows. The following bar graph shows the quarterly profit (in lakhs) of a departmental store ...
Question
Study the given bar graph and answer the question that follows.
The following bar graph shows the quarterly profit (in lakhs) of a departmental store from 1997 to 2000.
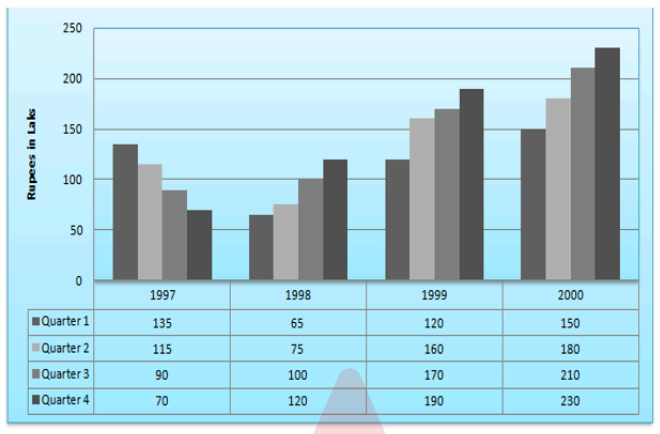
What was the percentage increase in annual profit of the departmental store from 1997 to 2000?