The bar-graph shows the sales of books (in thousands) from six branches (B1, B2, B3, B4, B5 and B6) of a publishing company during two consecutive yea...
Question
The bar-graph shows the sales of books (in thousands) from six branches (B1, B2, B3, B4, B5 and B6) of a publishing company during two consecutive years 2000 and 2001.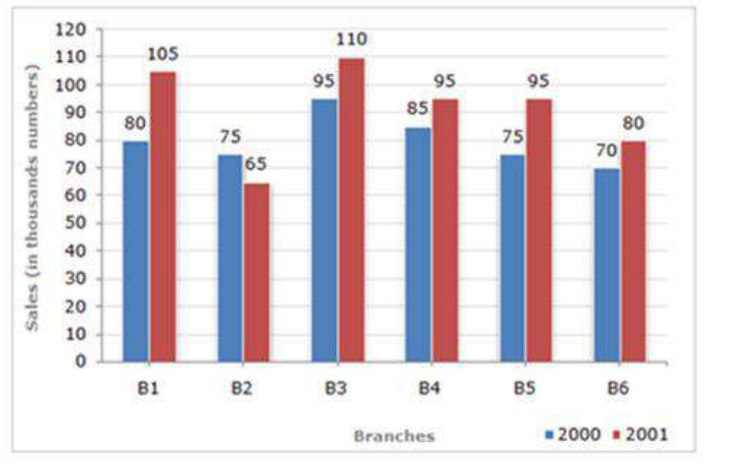 What is the ratio of the total sales of branch B2 for both years to the total sales of branch B4 for both years?