The monthly production of electric bulbs by a company during the second half of the year 2021 is shown by the following bar graph. Study the bar graph...
Question
The monthly production of electric bulbs by a company during the second half of the year 2021 is shown by the following
bar graph. Study the bar graph carefully and answer the question given below.
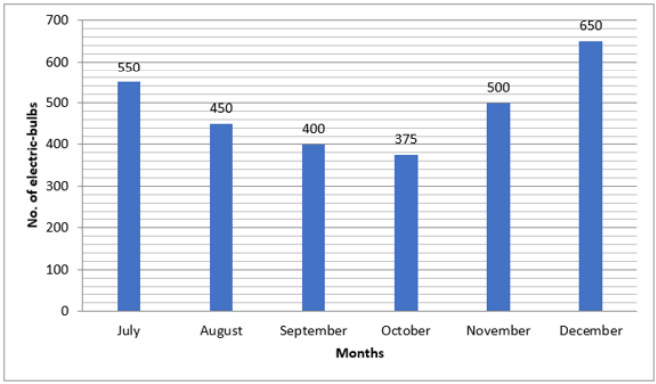
What is the percentage decrement in the production of electric bulbs in October as compared to the production in July?
(Correct up to two decimal places.)