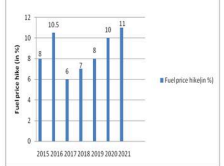
The following bar chart shows the year-wise percentage hike in the fuel price with respect to the previous year. In how many years did the fuel prices...
Question
The following bar chart shows the year-wise percentage hike in the fuel price with respect to the previous year. In how many years did the fuel prices NOT rise?