The figure shows the production of mobiles (in lakh units) in four cities (Delhi, Chennai, Mumbai, Kolkata) from 2018 to 2022. What is the ratio betwe...
Question
The figure shows the production of mobiles (in lakh units) in four cities (Delhi, Chennai, Mumbai, Kolkata) from 2018 to 2022.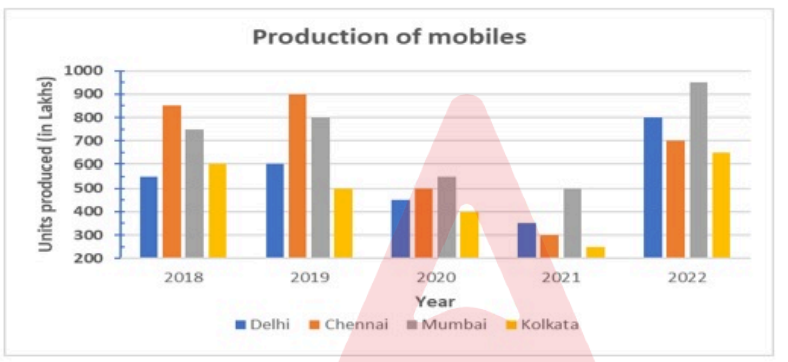 What is the ratio between the average production in Delhi and Kolkata during the period of 2019 to 2022?