The given bar graph shows the production of bikes by a company (in thousands) over the years. In how many of the given years was the production of bik...
Question
The given bar graph shows the production of bikes by a company (in thousands) over the years.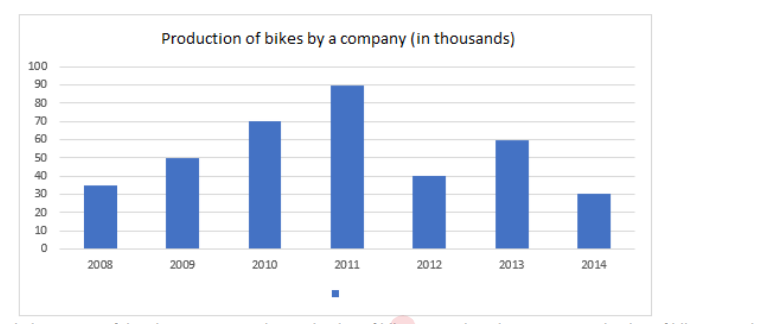 In how many of the given years was the production of bikes more than the average production of bikes over the years?