The given bar graph shows the foreign direct investment (in million dollars) in Country A from all over the world over the given years. What was the r...
Question
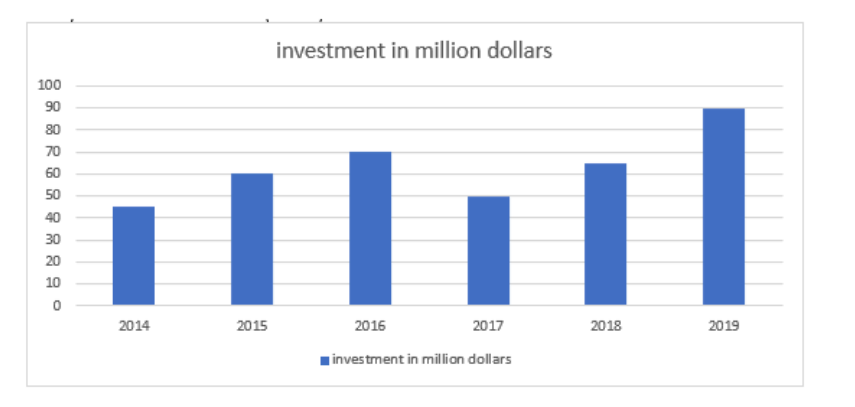
The given bar graph shows the foreign direct investment (in million dollars) in Country A from all over the world over the given years. What was the ratio of investment in 2018 to that in 2015?