The bar graph below shows the production of coffee (in lakh tons) by four companies A, B, C and D over a period of four years from 2010 to 2013. Study...
Question
The bar graph below shows the production of coffee (in lakh tons) by four companies A, B, C and D over a period of four
years from 2010 to 2013. Study the graph and answer the question that follows.
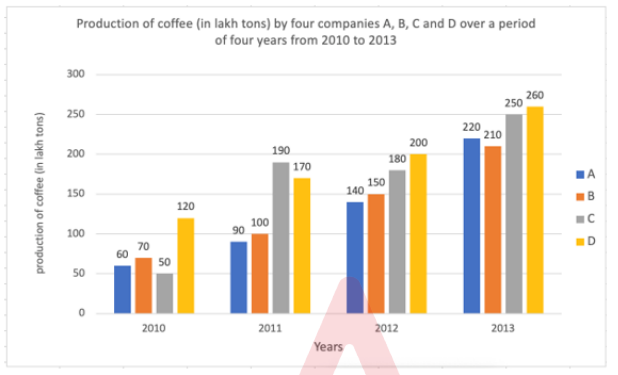
The combined average production for four years of companies A and C is what percentage (rounded off to 2 decimal places) more/less than the combined average production for four years of companies B and D?