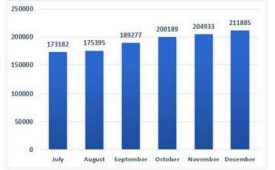
The following bar graph shows the circulation growth of a magazine ABC from July 2022 to December 2022. During October to December there was an even g...
Question
The following bar graph shows the circulation growth of a magazine ABC from July 2022 to December 2022. During October to December there was an even growth rate, the average of which, is (correct up to one decimal place):