Study the given chart and answer the question that follows. The following chart shows the production of textbooks in thousands in the years 2018, 2020...
Question
Study the given chart and answer the question that follows.
The following chart shows the production of textbooks in thousands in the years
2018, 2020 and 2022 from the print houses A, B and C, respectively.
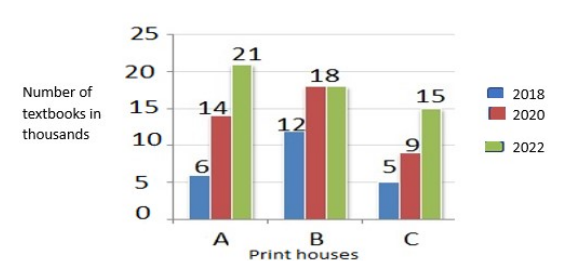
The ratio of textbooks produced by Print house B in the year 2018 to the
textbooks produced by Print house C in the year 2020 is ______.