The given bar graph shows the turnover of five companies (in crores) for the years 2017-18, 2018-19, and 2019-20. What is the difference between the a...
Question
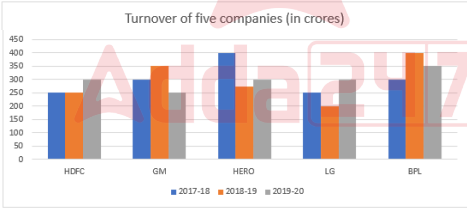
The given bar graph shows the turnover of five companies (in crores) for the years 2017-18, 2018-19, and 2019-20. What is the difference between the average sales turnover of all the companies put together between the years 2018-2019 and 2019-2020?