The given graph shows the number of male and female volunteers for helping handicapped people from four different districts A, B, C and D. Find the nu...
Question
The given graph shows the number of male and female volunteers for helping handicapped people from four different districts A, B, C and D.
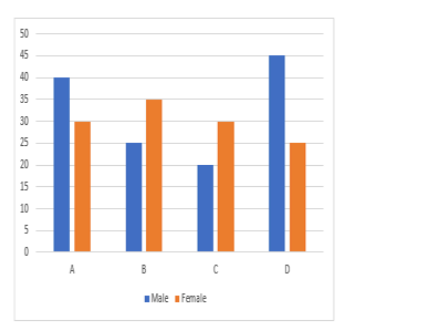
Find the number of volunteers altogether.