The given pie chart shows the amount of money (₹) spent (in degrees) on various sports by a sports academy in a particular year. Study the pie chart a...
Question
The given pie chart shows the amount of money (₹) spent (in degrees) on various sports by a sports academy in a particular year. Study the pie chart and answer the question that follows.
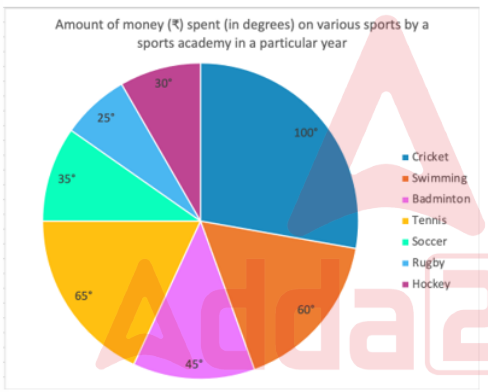
If ₹42,000 were spent on Soccer, then the money spent on Badminton, Tennis and Rugby taken together is what percentage (rounded off to 2 decimal places) more/less than the money spent on Cricket, Swimming and Hockey taken together?