The pie chart below shows the percent sale of different fruits in a day for a shop. If the total number of fruits sold by a fruit seller in a day is 1...
Question
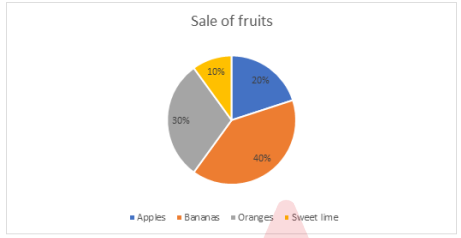
The pie chart below shows the percent sale of different fruits in a day for a shop. If the total number of fruits sold by a fruit seller in a day is 1200, what is the combined central angle in the pie chart for oranges and apples?