The given pie chart shows the number of students admitted into different classes of a school in the academic year 2022-23. How many students were more...
Question
The given pie chart shows the number of students admitted into different classes of a school in the academic year 2022-23.
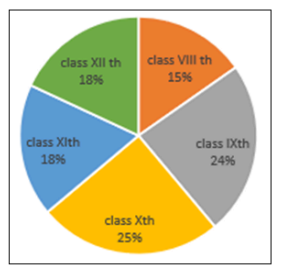
How many students were more in Class 10 than in Class 12 if 600 students were admitted into Class 8?