In 2010, a company’s total expenditure was categorised under different expense heads, and their percentage distribution is illustrated in the bar grap...
Question
In 2010, a company’s total expenditure was categorised under different expense heads, and their percentage distribution
is illustrated in the bar graph given below.
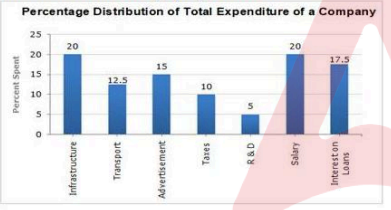
The total amount of expenditure of the company is ________ times that of expenditure on R & D.