The given bar graph shows the number of students enrolled in Institutes A and B during 5 years (2018 to 2022). What is the ratio of the total students...
Question
The given bar graph shows the number of students enrolled in Institutes A and B during 5 years (2018 to 2022).
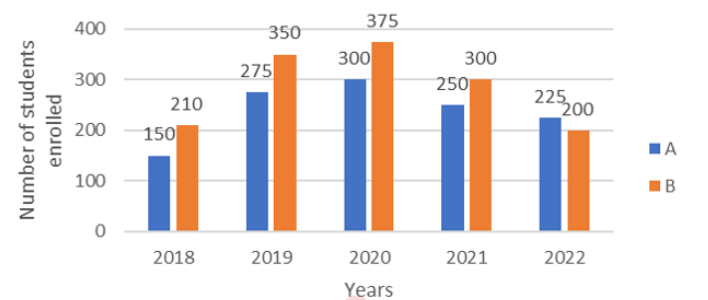
What is the ratio of the total students enrolled in Institute B in 2019, 2020 and 2022 to that of the total students enrolled in
Institute A in 2018, 2020 and 2021?