The following pie chart shows the percentage distribution of a total of 1600 employees in different departments of a company. The table shows the rati...
Question
The following pie chart shows the percentage distribution of a total of 1600 employees in different departments of a
company. The table shows the ratio of male to female employees in different departments. Study the information and answer
the question that follows.
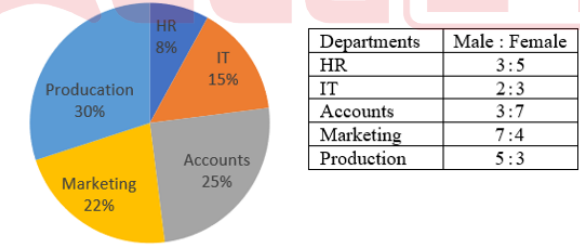
What is the percentage of the number of employees in production department to the number of female employees of all the
departments taken together? (correct to one decimal place)