The table below shows the number of cars produced (in lakhs) by six different brands (A, B, C, D, E, F) from 2018 to 2023. Which brand had the highest...
Question
The table below shows the number of cars produced (in lakhs) by six different brands (A, B, C, D, E, F) from 2018 to 2023.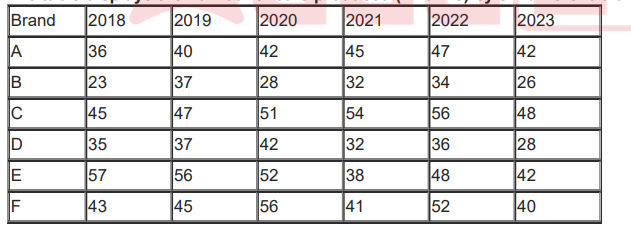
Which brand had the highest production in a single year, and in which year did this occur?