Tables
Practice Questions
The given table shows the production of different types of refrigerators in a company from 2011 to 2015.  per annum over the years. The total expenditure on a...
#4Based on the given table, if at least 40% marks in Mathematics are required for pursuing higher studies in Mathematics, ...
#5The below table gives the marks out of 100 obtained by five students in four different subjects in an examination. Study...
#6The following table shows the sale (in thousands) of different types of helmets by a shop over the given years. , and answer the question that...
#11Y’s average speed (in km/hour) during the first five hours is to be found, given the distances travelled by Y in each of...
#12The following table represents the total number of students in different classes and the respective number of students w...
#13The table shows the percentage distribution of students in four different schools during the years 2021-22. If the total...
#14Study the table of exports (in units) from three companies over the years 2017 to 2021. ...
#23The table shows the sales (in units) of a company for different cities in the months of June and July, 2022.  F...
#25Study the given table and determine for which year the total daily consumption of Rice, Wheat, Pulses, and Vegetables is...
#26Study the given table answer the question that follows. The following table shows the income of a person (in thousand ru...
#27Study the given table and answer the question that follows. The following table shows the production of printers by fou...
#28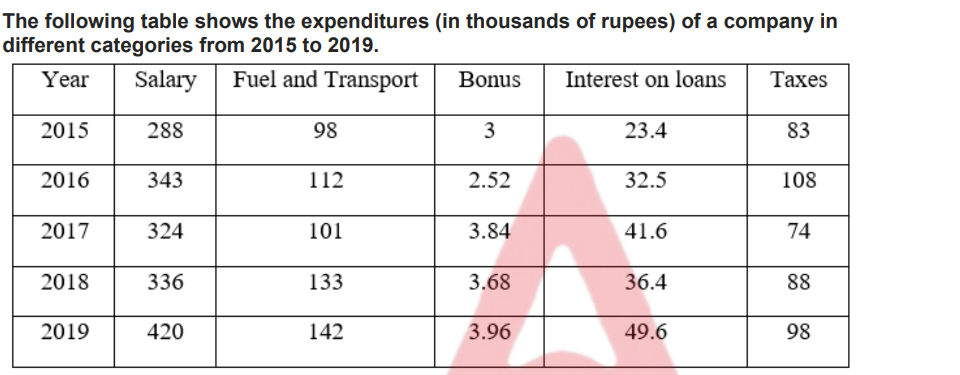 ...
#29Find the ratio of the total number of sales of the motorbikes of manufacturer Q to the total number of sales of the moto...
#30The table below shows the number of cars produced (in lakhs) by six different brands (A, B, C, D, E, F) from 2018 to 202...
#31What is the ratio of male research scholars in Mathematics to Statistics?  than that of ...
#33The following table shows the sale (in lakh rupees) of six commodities in a provision store from August 2012 to October ...
#34The following table shows the expenditure of a company (in ₹ lakh) per annum over the given years. The total amount of b...
#35The following table shows the production (in units) and sales, of different items of a steel company. In which item is t...
#36Fi...
#37In which of the given year(s) was the production of B type refrigerator closest to its average production over the given...
#38The given table shows the number of books on different subjects: | Subjects | Number of books | |----------|-----------...
#39The table below shows incomes (in rupees) earned by five employees of a company during the month of March 2019 and the i...
#40Given the population data of a city from 2012 to 2021![image.png](https://res.cloudinary.com/aptidude/image/upload/v1746...
Start Practicing Tables
Test your understanding with interactive practice and detailed solutions.
Practice Now →