The given table shows the production of T-shirts (in thousands) by four companies C1, C2, C3, and C4 over the years 2019 to 2022. Which company had th...
Question
The given table shows the production of T-shirts (in thousands) by four companies C1, C2, C3, and C4 over the years 2019 to 2022.
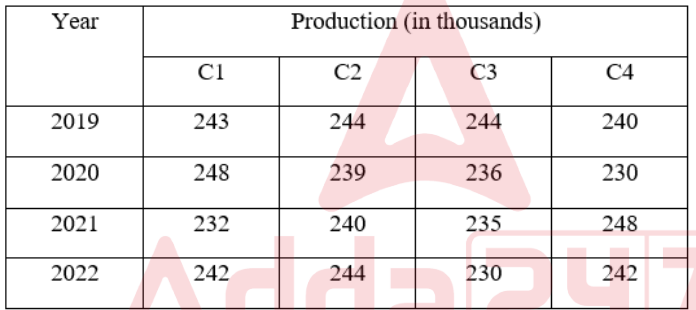
Which company had the maximum average production during these four years?