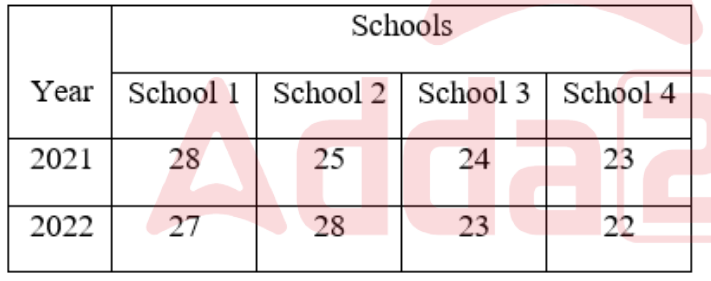
The table shows the percentage distribution of students in four different schools during the years 2021-22. If the total number of students was 16,000...
Question
The table shows the percentage distribution of students in four different schools during the years 2021-22. If the total number of students was 16,000 in 2021 and 18,000 in 2022, find the difference in the number of students in School 4 in 2022 compared to 2021.