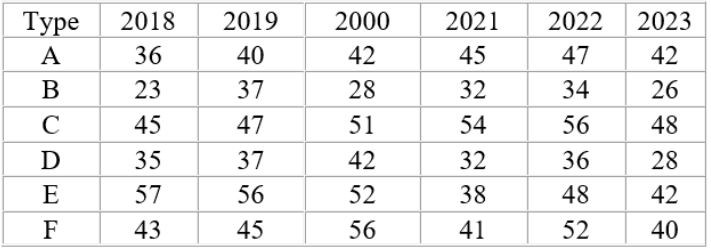
The table displays the number of cars produced (in lakhs) by six different brands between 2018 and 2023. Find the difference in the average production...
Question
The table displays the number of cars produced (in lakhs) by six different brands between 2018 and 2023. Find the difference in the average production of brands B and D during 2018-2023.